The Ads Manager and the Power Editor are now a single, better and more versatile tool, and one of the areas that have been improved is the ads reporting.
Reports have now a well-deserved place in the business account top menu, making them easier to reach or configure. Here’s a short video on how to use them:
How to create Ads Reports
Open your business account top menu and click on the “Ads Reporting” link.
Click on the “Create Report” button.
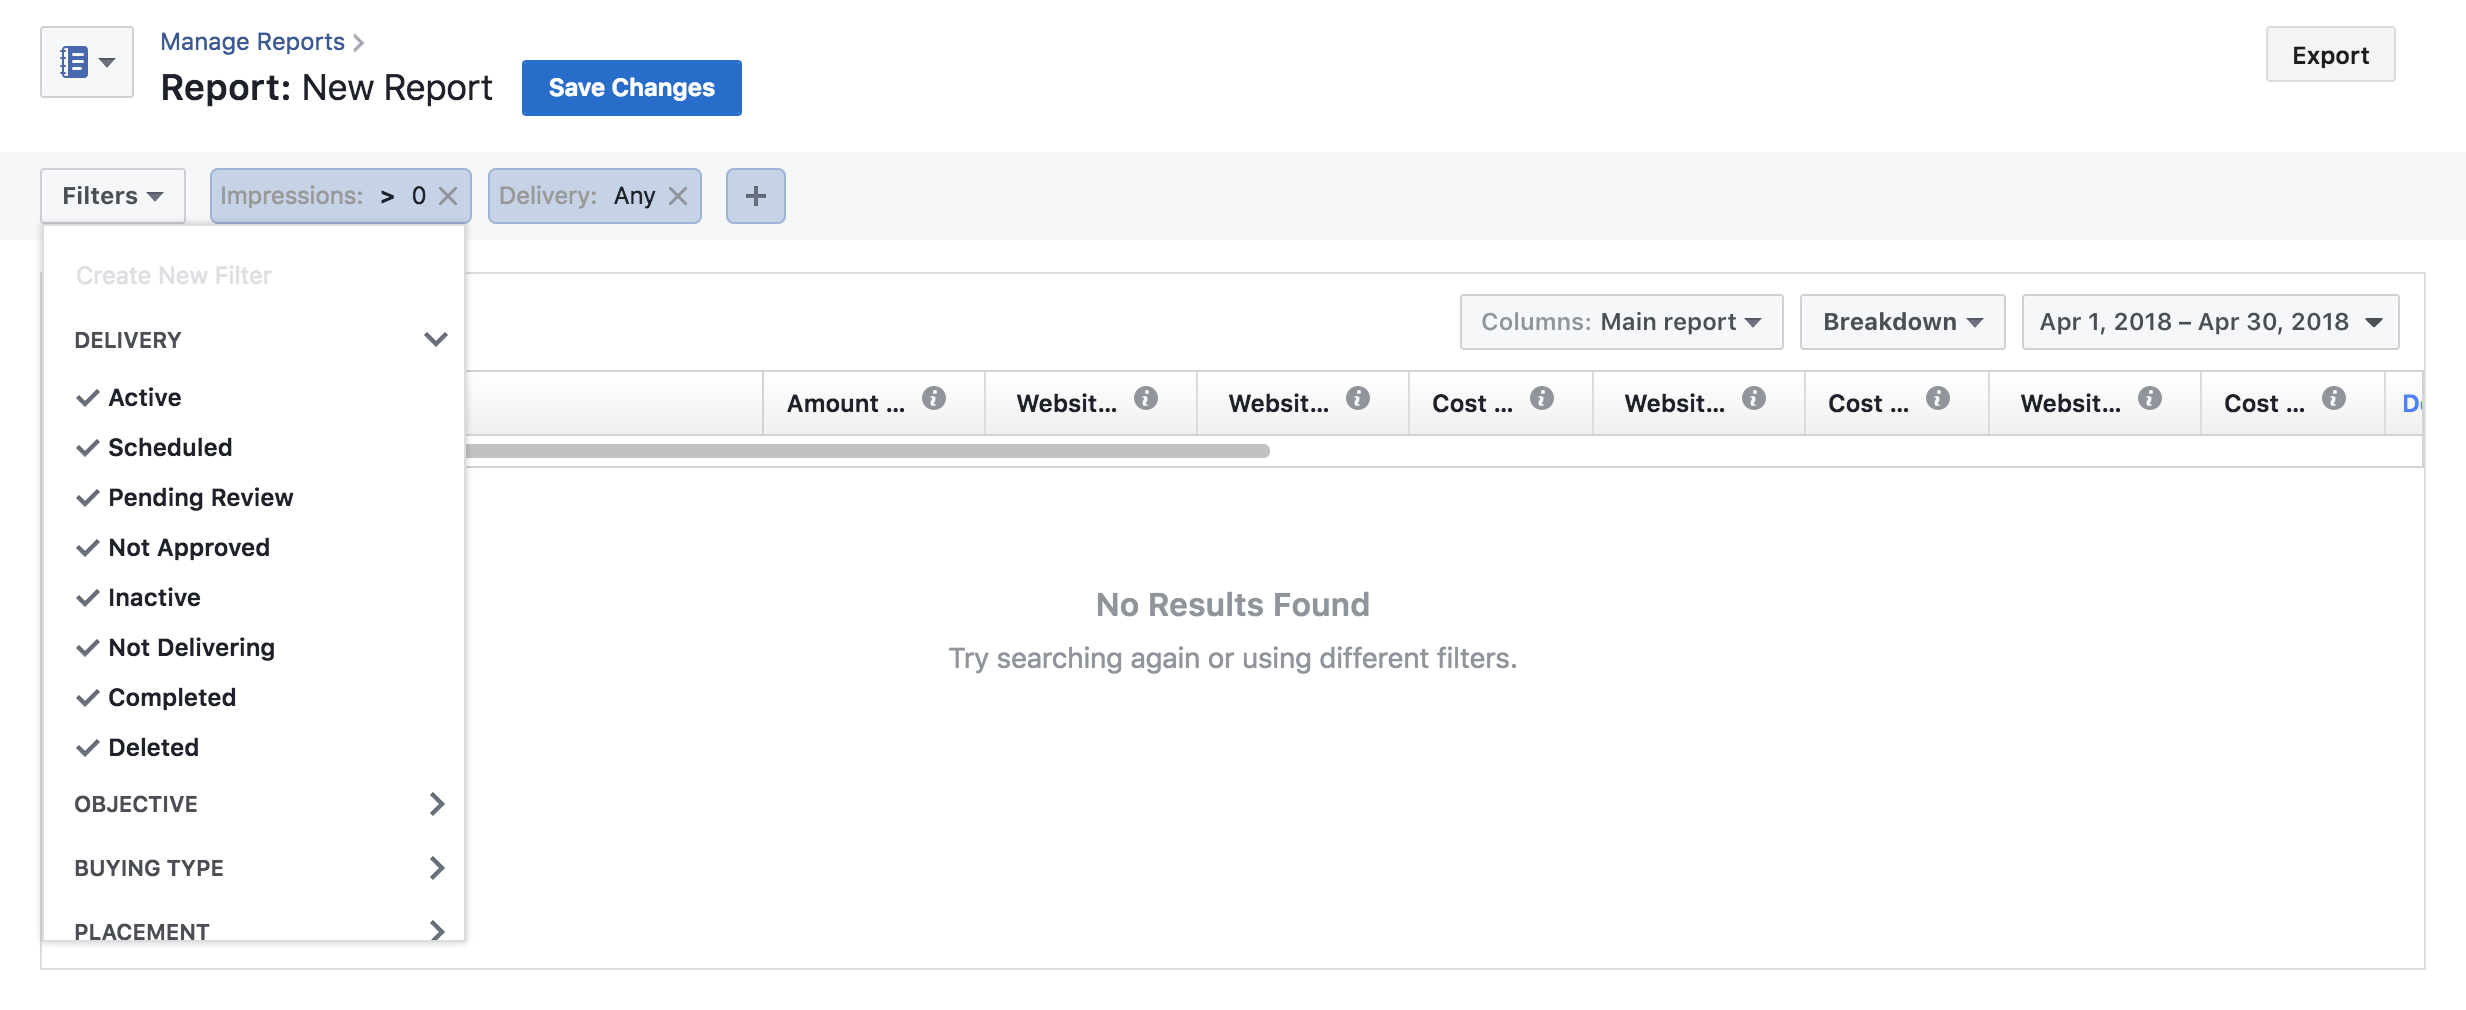
Now you can configure your new report.
You can use “Filters”, like DELIVERY, OBJECTIVE, BUYING TYPE, PLACEMENT, METRICS, DATE UPDATED, SPLIT TEST:
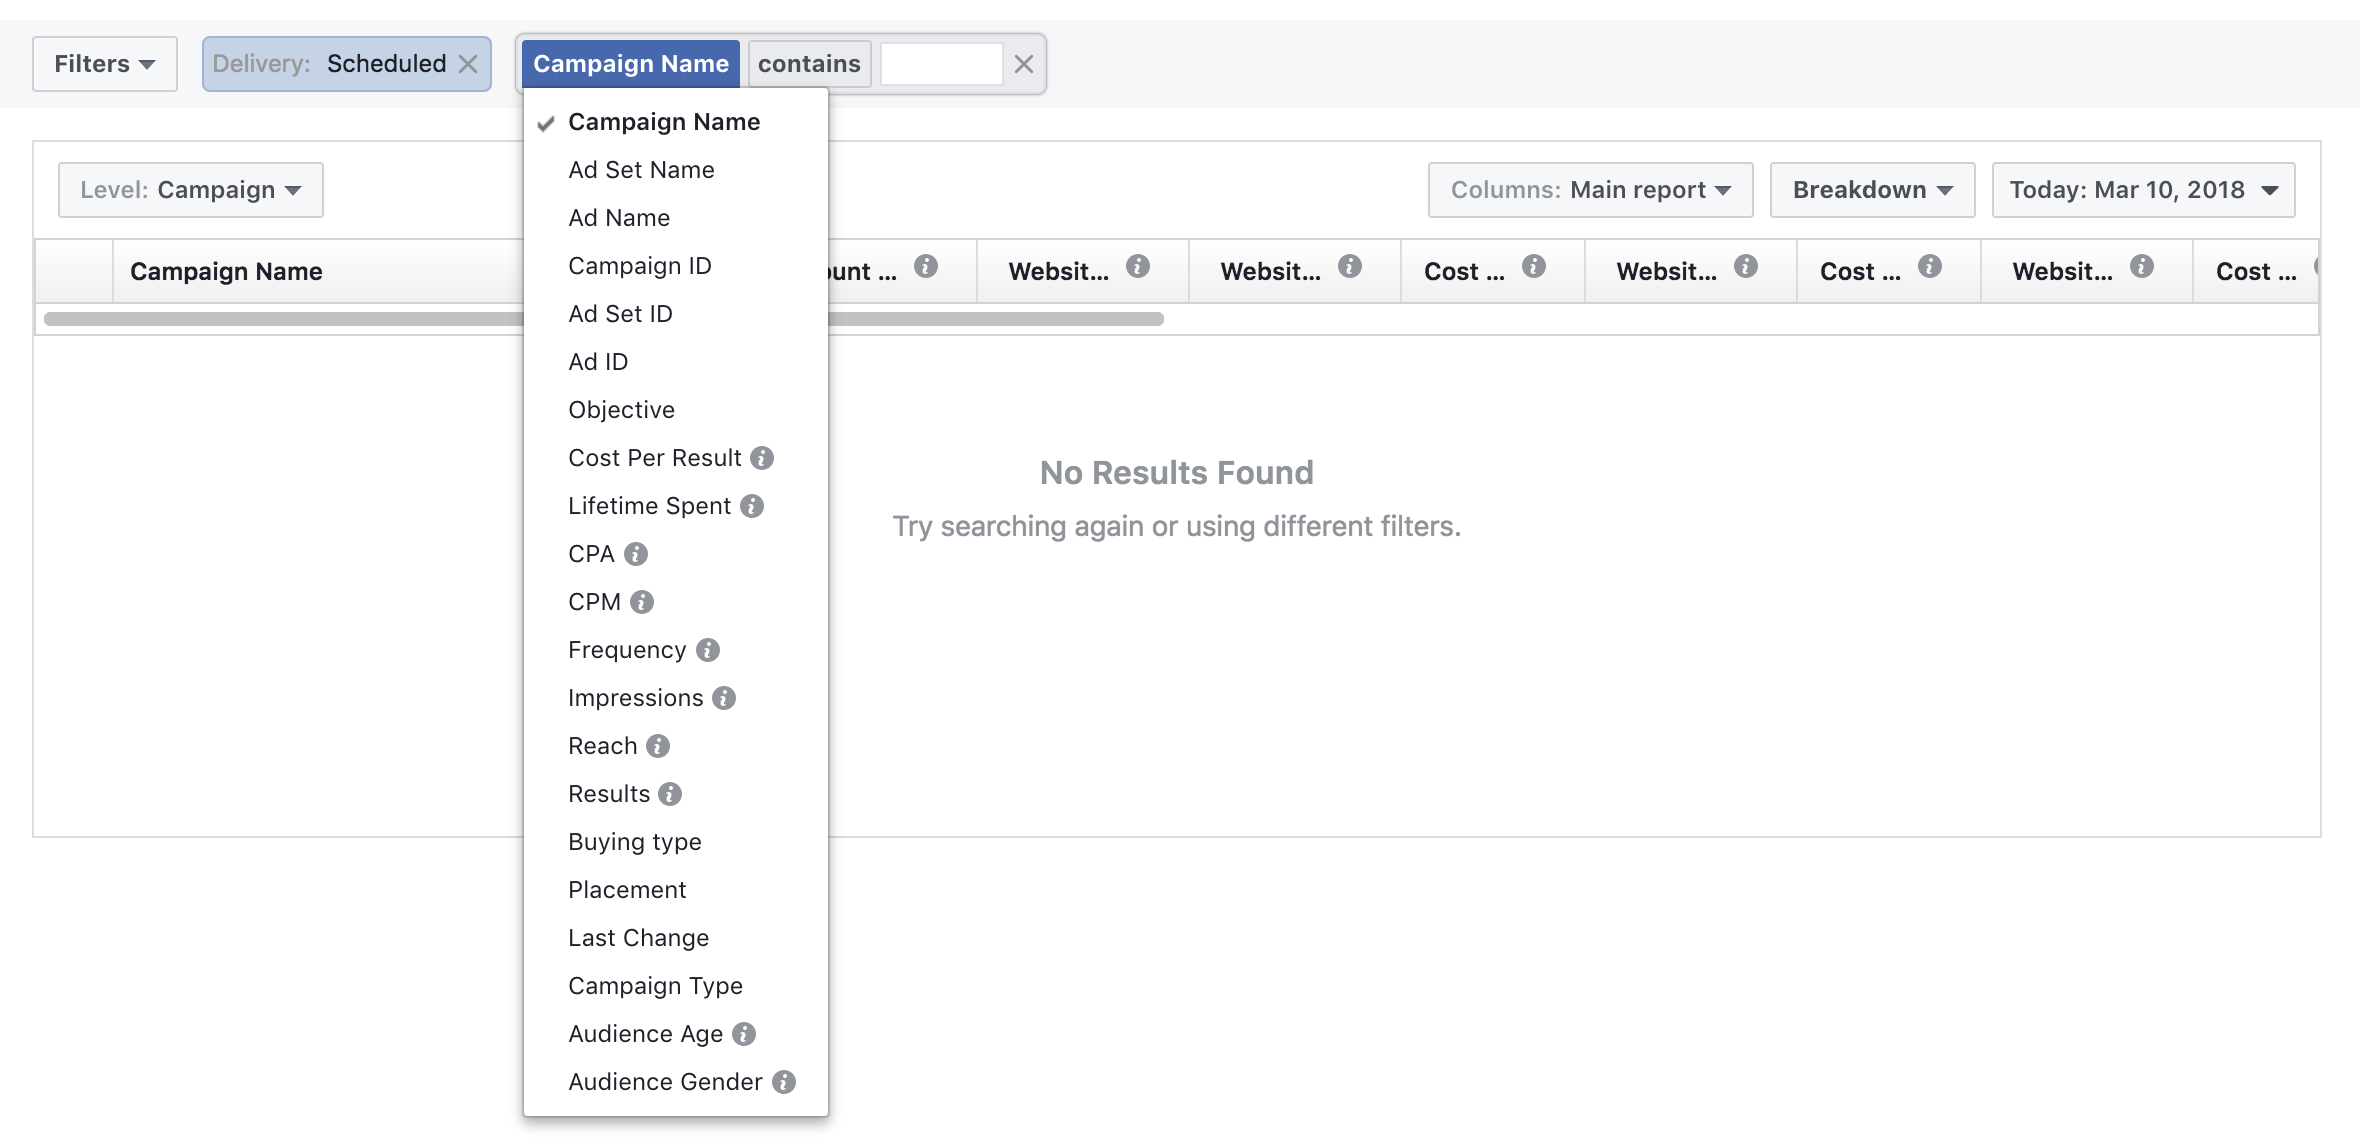
You can use additional conditions, like Campaign Name, Ad Set Name, Ad Name and so on:
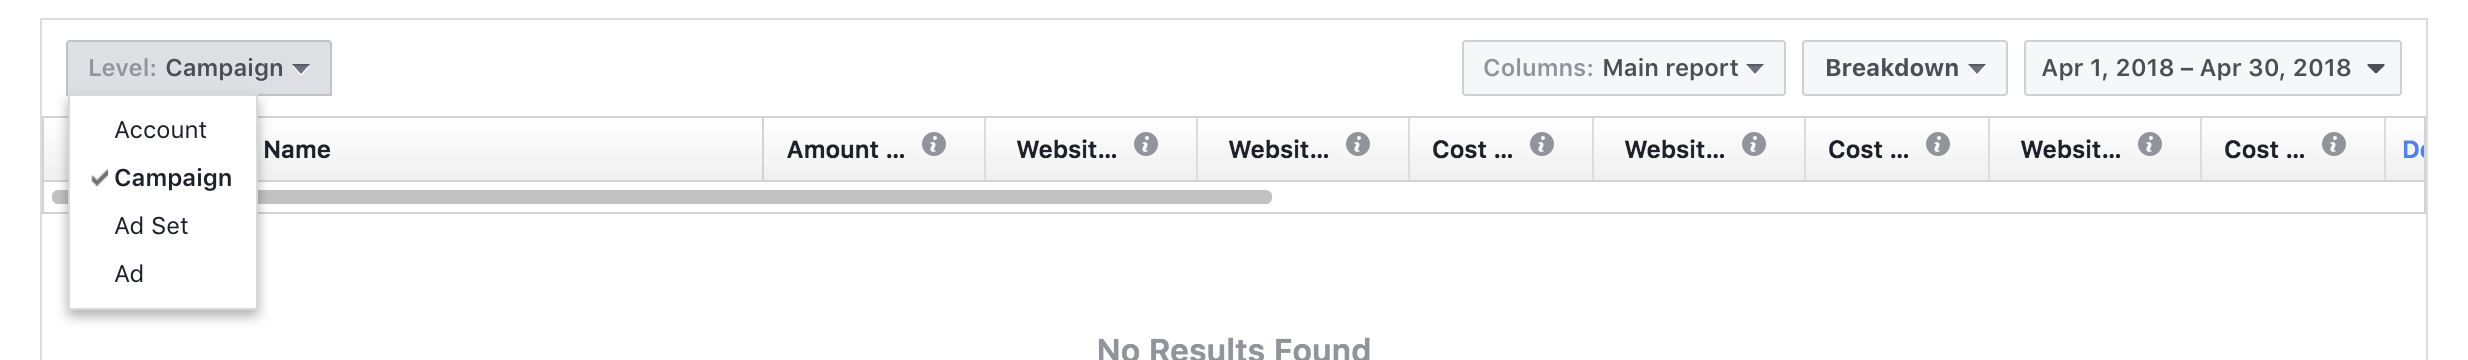
You can select “Level”: Account, Campaign, Ad Set, Ad:
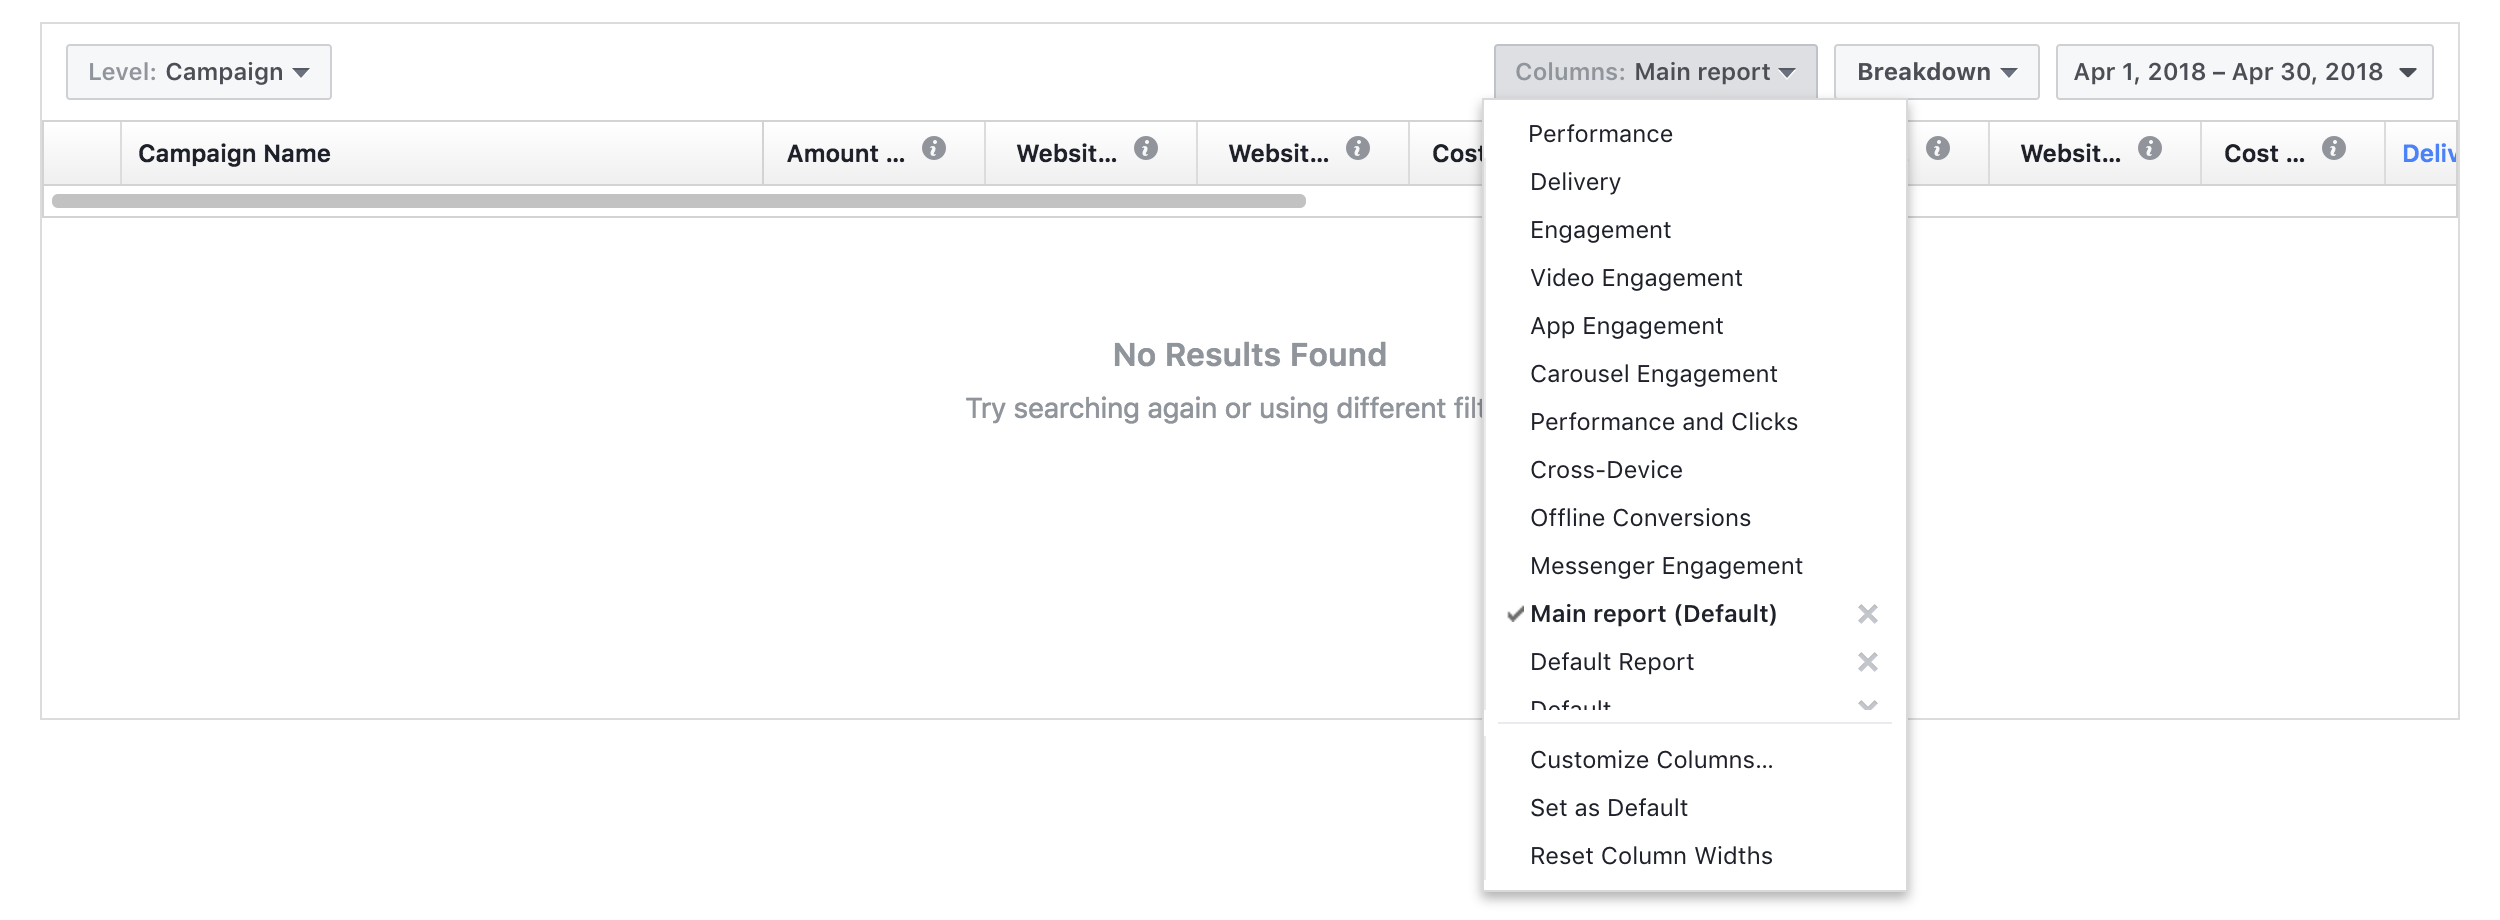
You can select a pre-defined column configuration, or create a custom one:
You can also select the time frame for the report. Once you’re ready, click “Save Changes” and give a relevant name for your report.
Recommended reports:
These are the reports you should consider having:
Running Campaigns
Filter: Impressions > 0
Level: Campaign
Timeframe: Today
Why is useful: it helps me to easily check each campaign performance. Once I’m in, I can easily change the Level to see ads set or individual ads performance.
Pending Ads
Filter: Delivery: Pending review
Level: Ads
Timeframe: Today
I can check what ads are still under review.
Not Approved Ads
Filter: Delivery: Not approved
Level: Ads
Timeframe: Today
I immediately see what ads have problems and need my attention.
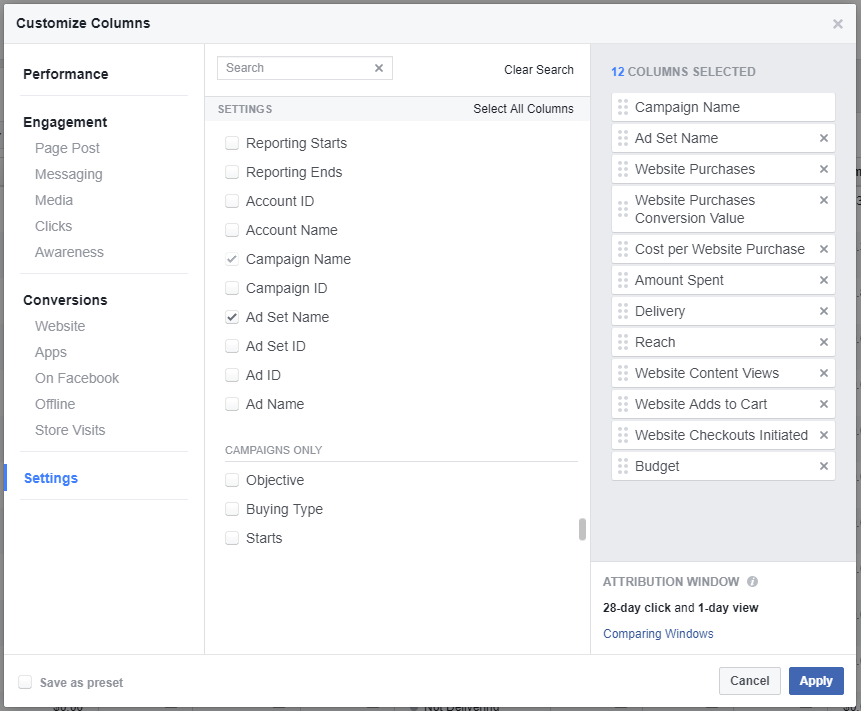
How to customize report’s columns
This part is crucially important if you want to really understand your ads performance. Clicking on the “Columns” selector you can choose any of the pre-existing configurations, or you can som of your own:
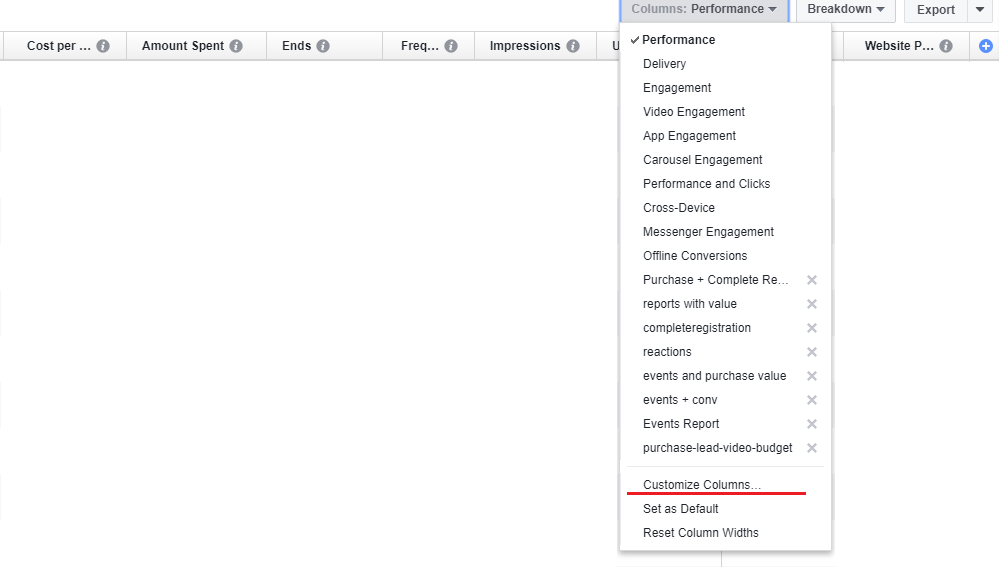
Facebook groups the custom columns in a few categories:
- Performance: key data about your ads performance, like results, reach, frequency, relevance score (ad level only), the amount spent, amount spent today, etc.
- Engagement: page/post interactions, messaging, media views, clicks, awareness
- Conversions: on Website (your pixel events), Apps, On Facebook, Offline, Store Visits
- Settings: reporting starting and ending dates, account ID and name, campaign ID and name, campaign objective and a few other similar things
Tip: select only the columns that can be of real interest to you, otherwise it will be complicated to read the report. Try to keep things simple.
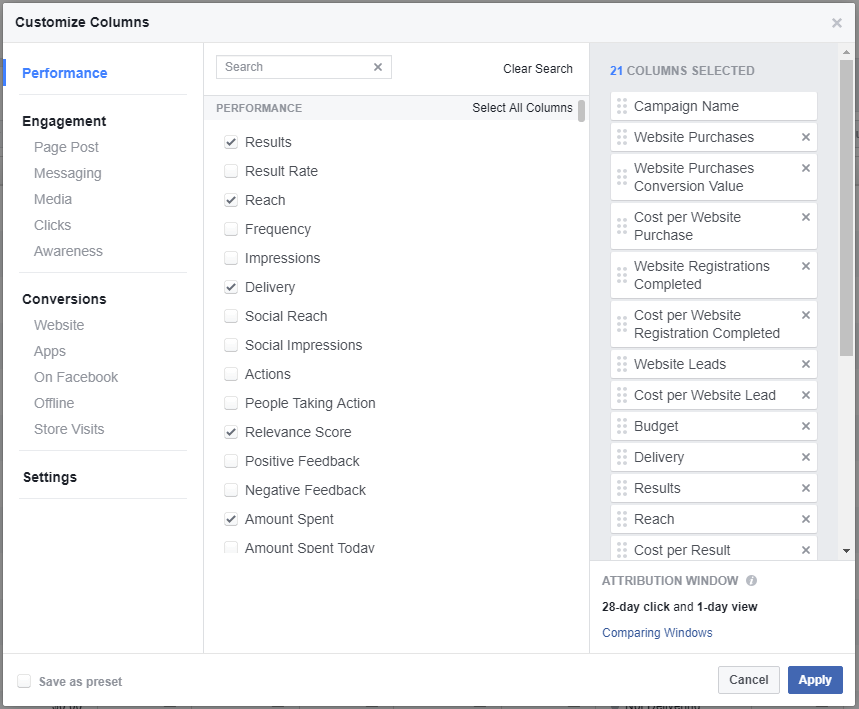
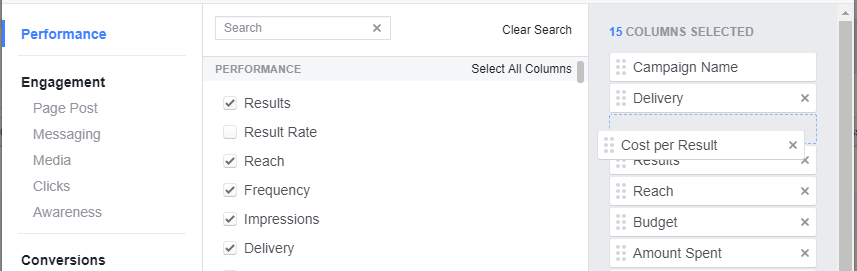
Once selected, the columns will start to appear on the right side of the window. You can drag and drop them to reorder:
When you are happy with the columns and their order, you can save this as a default report. Click “Save as preset” from the bottom left corner and type your name:
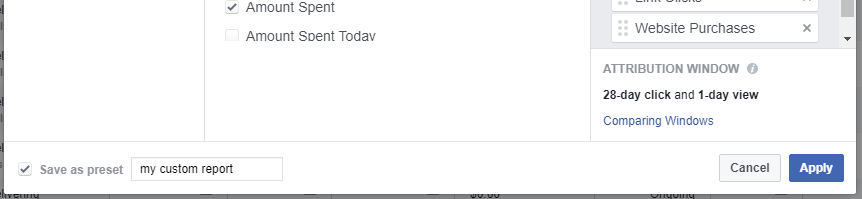
Once saved, this new column configuration will become available for selection. You can also choose to “Set as default”.
To delete a column configuration you can click on the X next to it. Facebook default configurations can’t be deleted.
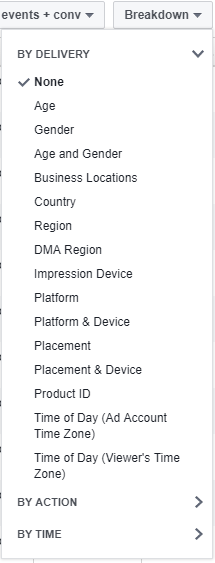
Breakdown can bring some additional information about your ads. You can break down your reports By Delivery, By Action or By Time:
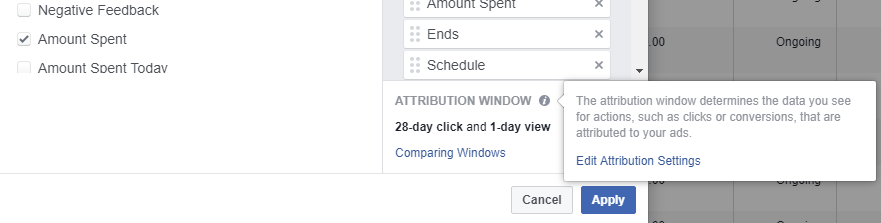
Attribution window
The attribution window determines the data you see for actions, such as clicks or conversions, that are attributed to your ads. By default, Facebook uses 28 days for clicks and 1 days for views. You can change these settings from your ad account reporting settings. To get there, move your mouse over the i next to the ATTRIBUTION WINDOW and click the Edit Attribution Settings link:
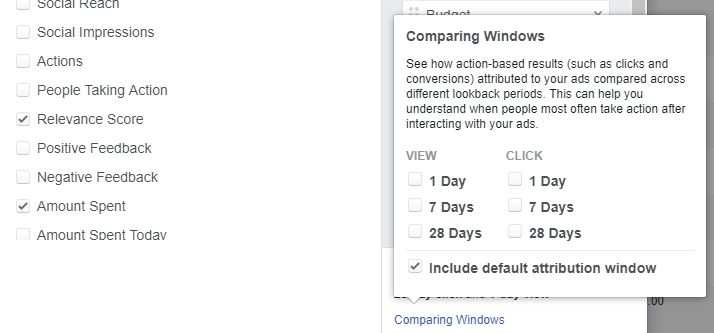
Comparing Windows
See how action-based results (such as clicks and conversions) attributed to your ads compared across different lookback periods. This can help you understand when people most often take action after interacting with your ads.
Click on the “Comparing Windows” link and select your desired time frames:
Recommended column configuration for e-commerce sites (WooCommerce or Easy Digital Downloads)
1. Click on Columns and select Customize Columns

2. Click Website (left part of the popup) and then check:
WEBSITE (FACEBOOK PIXEL):
- Website Add to Cart
- Website Checkout Initiated
- Website Purchase
- Website Content View
COST: WEBSITE (FACEBOOK PIXEL):
- Cost per Website Purchase
CONVERSION VALUE: WEBSITE (FACEBOOK PIXEL):
- Website Purchase Conversion Value
3. In the right side menu, drag and drop to rearrange the columns for better reading
You can also delete unnecessary columns, to have an easy to understand report. Some columns will be added there by default and you probably won’t need them.