Not so long ago, Facebook Analytics was mostly dedicated to apps, with very little website related features. But things have dramatically changed, and Facebook is stepping into Google Analytics territory. It’s a bold move that can scatter the long-lasting Google’s reign in the website tracking universe.
This is also a major step forward for the Facebook pixel. Until recently, you could realistically use the pixel for ads optimization, ads reports, custom audiences and custom conversions. It was a very handy add related tool, but no much more than that.
Things are different now! With the new Facebook Analytics approach, the pixel has been transformed into a truly website tracking device. I honestly believe that there are some areas where Facebook is already better than Google, especially when it comes events reporting and funnels.
You’ll be able to find out things like “what searches are performed on your site”, “what categories are your best sellers”, “your buyers’ age or gender,”, “what content is performing best”, and so on.
The fact that you have combined data for various channels, your Facebook page included, only make things more exciting.
This article is not meant to be a complete Facebook Analytics guide because the subject is way too vast to be covered in just one go. What I’ll try to do instead, is to give you the very basic knowledge that can help start exploring your reports, and a few insights about how to find and interpret the data your pixel is sending to Facebook.
PixelYourSite Pro truly shines with Facebook Analytics. It tracks each search made on your site, all the clicks performed by your users (find more here), each embedded video view (YouTube or Vimeo), and AdSense ads clicks. On WooCommerce or EDD it automatically implements the e-commerce related events, sending super-valuable data that you can see via Facebook Analytics.
How to access your Facebook Analytics
If you’re completely new to Facebook Analytics, you will need to configure it first. Don’t worry, it’s easy and intuitive. You can start from here: https://analytics.facebook.com
Click on the “Go to Analytics” link in the top menu. It’s possible that you’ll be required to perform a few steps, like account confirmation by phone or text message. It really depends on your current setup.
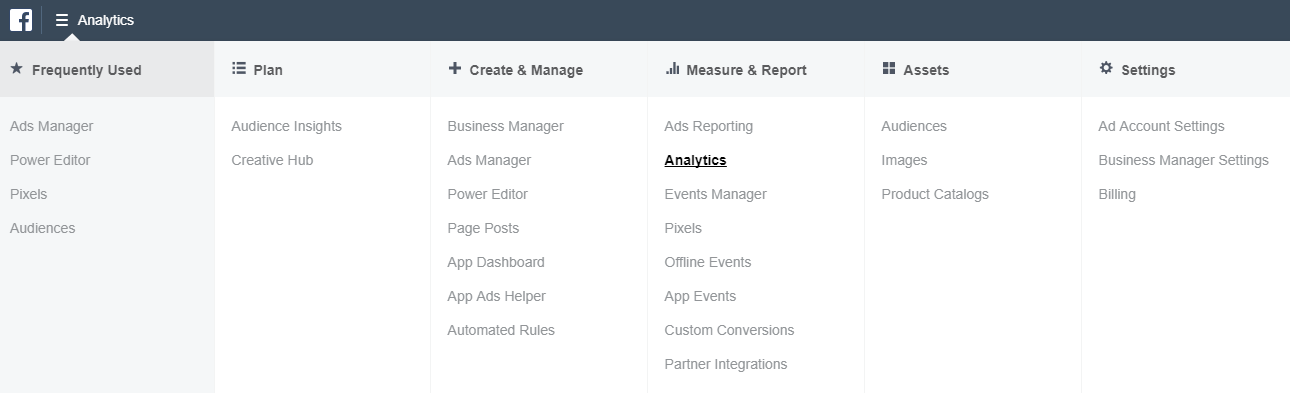
If you already have an active Analytics account, you can access it from your Ads Manager’s top menu:
Once you’re in, you will see a list of your apps, pages, and pixels, together with some basic stats: Monthly Active users, Monthly New Users, Monthly Revenu. Select the pixel that’s installed on your website.
![]()
Generate and understand your Facebook Analytics reports
Overview
The first thing you’ll see it’s an Overview, with a lot of information combined. The reported REVENUE comes from the Purchase event value. Make sure you remember this, especially if you use a price percent for this event value (some of our top users prefer to experiment with this strategy, reporting an improvement in ads’ ROI).
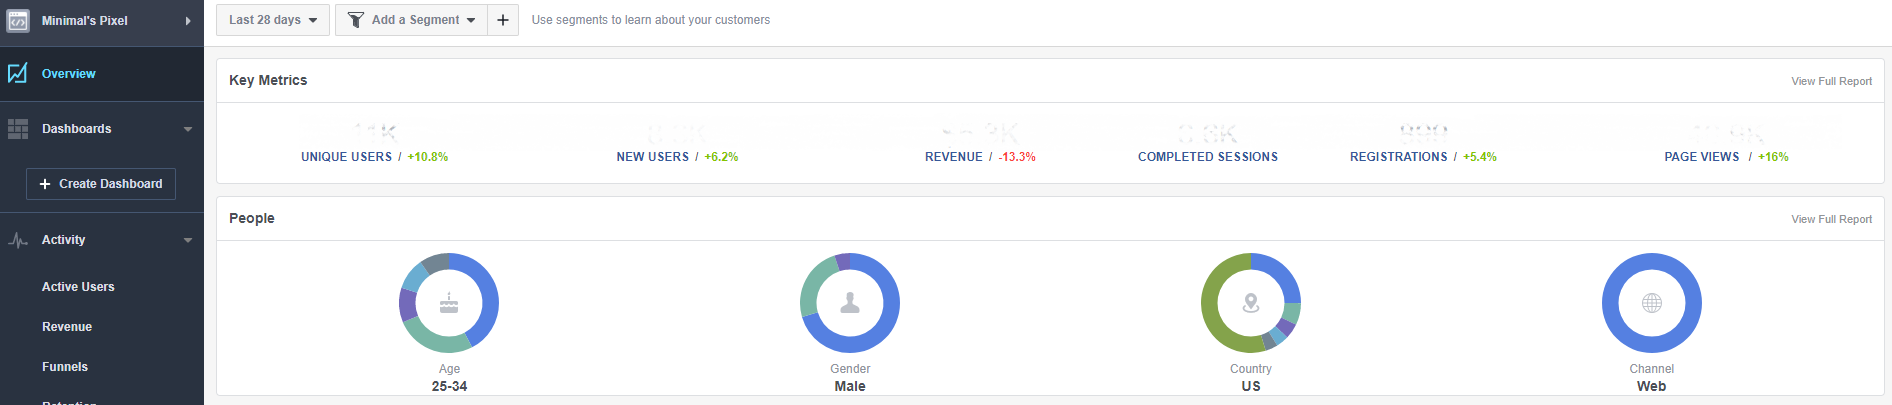
Spend some time to analyze the various sections on this page. You’ll see the top Traffic Sources, Top Referrers, top URLs, Search Sources, Social Sources, Median Sessions Lenght, Revenu, Age and Gender, Country, and Device OS.
This is just the tip of the iceberg, with only a small fraction of all the data you can explore.
From your left menu, you can dive into the various reports at your disposal:
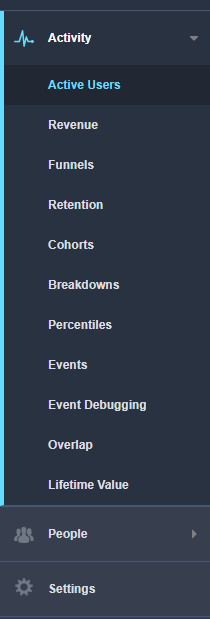
Some things are straightforward and intuitive, like Active Users or Revenu, so I won’t spend much time explaining how they work or what they are supposed to show.
Revenu
Revenu is calculated based on the Purchase event value. If other events also have a value parameter, this won’t have any impact on the revenu metric.
Revenu: it’s a metric based on the Purchase event value parameter only.
Value: each event can have its own value parameter. In this case, the value will be tracked for each particular event, but it won’t count for the Revenu report.
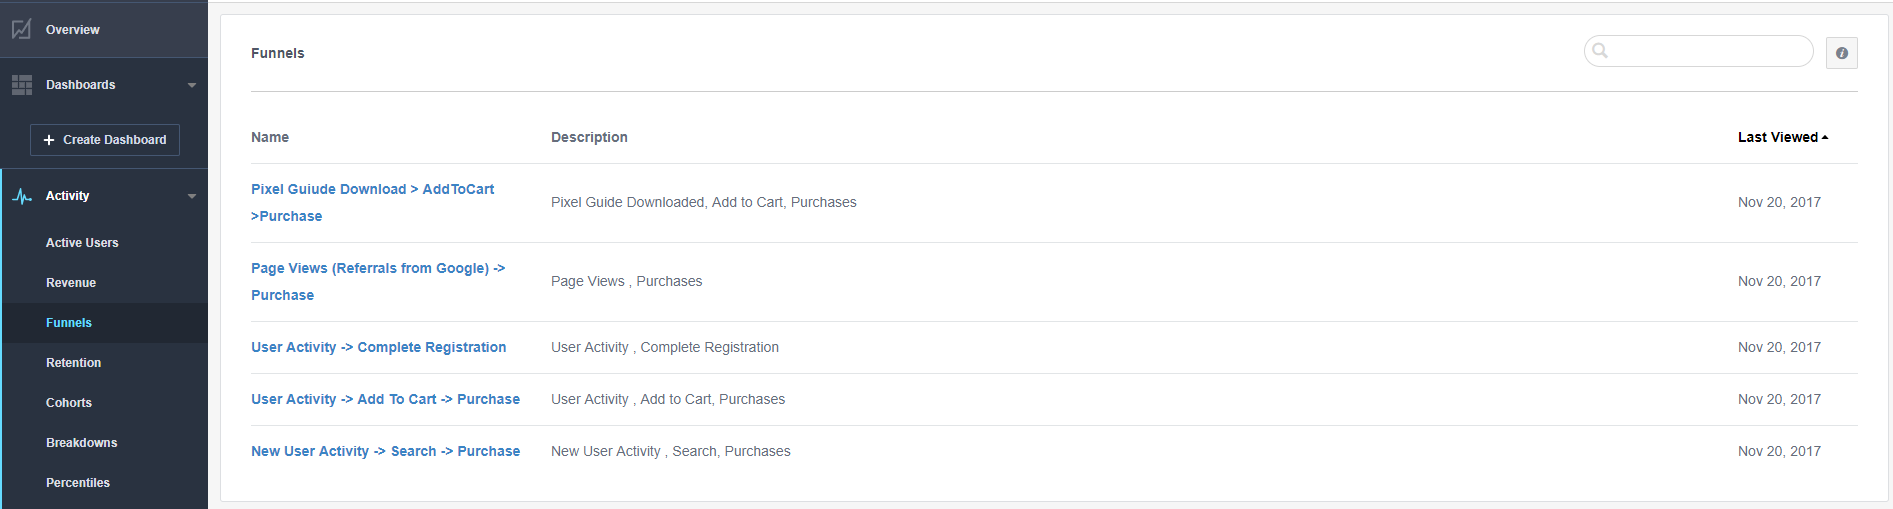
Funnels
This is one of the most interesting features that Facebook Analytics has to offer. Funnels are made up of events, which act as steps that you want to measure.
Facebook ads a number of default funnels that will prove to be very helpful, but you are free to configure your own funnels.
Create a funnel
Each funnel step is based on a pixel event and can include parameters as additional conditions. You can use Facebook standard events, or any custom event that you have on your website.
This is a funnel with 3 steps, based on the events you will usually have on a WooCommerce website: PageView, AddToCart, InitiateCheckout, Purchase. Since it’s possible that the same pixel is installed on multiple websites, I’ve also refined it by “Web Parameters”, adding my site domain. This way only the events fired on that particular website will count.
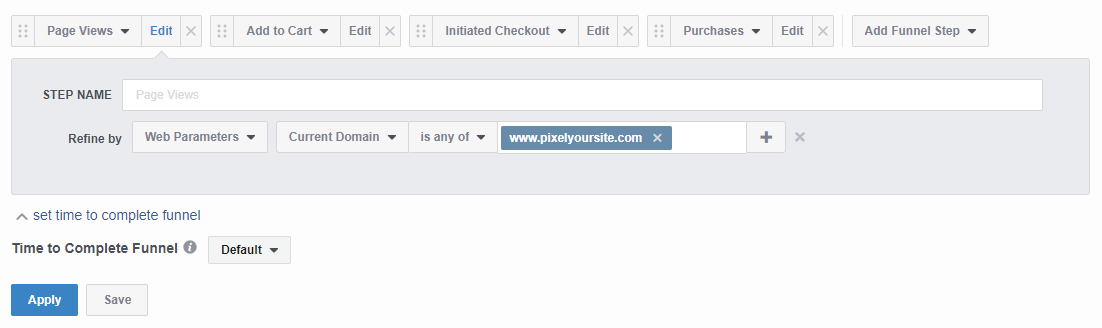
This particular funnel will give some valuable insights into what’s happening when someone decides to start a transaction by adding a product to cart. The funnel starts with any visit on your website (the Page Views event is fired by default on all your pages), giving you the opportunity to see what’s going on with each step your customers will take.
But you can also create much more specific funnels, tracking only specific products or categories. Each event parameter can be used here, giving you the opportunity to dig into som every interesting data.
Here’s an example of a funnel that will measure how many of your clients are using a coupon code:
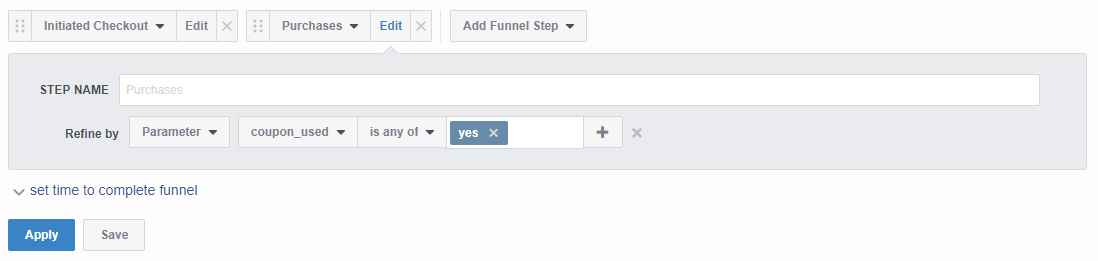
It starts with the InitiateCheckout event, fired on the Checkout page. This is a step that every client has to complete in order to send the order. The second step is based on the Purchase event and it’s refined by the coupon_used parameter. This way, ONLY Purchase events where the coupon_used value is YES will be considered a conversion.
The coupon_used parameter is just one of the parameters you can use with PixelYourSite Pro. You can read more about this here.
But you’re not limited to transactions only. You are free to define a funnel in any way you want. Here’s an interesting example:
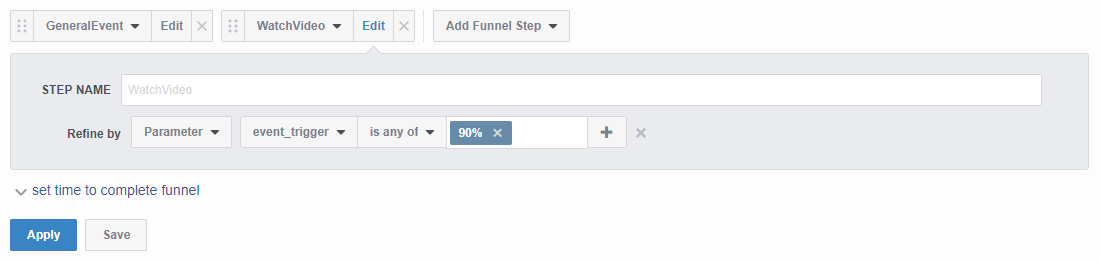
This particular funnel uses two of the PixelYourSite Pro custom events. The first step is based on the GeneralEvent, where the content_name parameter is Magic Row (one product that we sell). So the funnel will start when someone lands on the product page. The second step is based on the WatchVideo event and will be completed when at least 90% of the video is watched. This is an event that PixelYourSite Pro fires when an embedded video is played. As you can imagine, on the Magic Row page there is a video, and I am interested to see how many people watch it close to the end.
These three funnels example can show you how powerful this Facebook Analytics feature can be. A good understanding of your funnels is just the first step. Armed with this data, you can improve your site conversion.
How to use Funnels to increase sales
Once you have an idea of where your customers drop off, you can apply a few strategies:
Retarget with Facebook Ads: this is an obvious choice and you have a few options on how to implement it.
You can always have a Dynamic Product Ads campaign running, automatically retargeting users that viewed or added a product to cart without completing a transaction. This will work for most WooCommerce websites.
You can also run normal ads and target Custom Audiences. Create a custom audience based on the event where you have the bottleneck, exclude your customers, and target it with some smart ads. You can offer a discount code, to smooth things up. This strategy can work for all types of websites and is not limited to sales only. You can do it for anything, like newsletter signups, affiliate sales, or even video views.
Offer a discount coupon with an exit popup: this can be another way to handle things. If your customers are leaving, show them an exit popup with a discount code. You can also apply the code directly, with a link (there are plugins implementing this for WooCommerce). This strategy might not work in all cases and can’t be implemented on mobile.
Use a cart recovery service or plugin: If you have a large cart abandoned rate, implementing a cart recovery strategy can help. While it can give great results, it’s limited to those users that are logged in.
Redesign and improve your website: you probably don’t need to redo all from scratch. Try to think if there are elements you can improve on key pages where people get stuck.
Offer free shipping: shipping cost can be a deal breaker, so think of adding some free shipping options.
Retention (a fancy word for returning visitors)
Shows the percentage of people who return to your website, after the initial interaction. Retention can be viewed in daily, weekly or monthly intervals.
It’s an intuitive and interesting data to look at, so don’t ignore it. It’s also pretty intuitive, so I don’t think you’ll find it hard to use.
Cohorts
Cohorts are groups of people who perform two events you choose during a given time period, such as adding items to a cart and then purchasing. Cohorts help you measure and optimize for retention, lifetime value and more.
Here’s a cohort that I use myself: the first event is CompleteRegistrantion, fired when someone downloads one of our free guides (refined by the content_name parameter). The second event I want to track is the Purchase event.
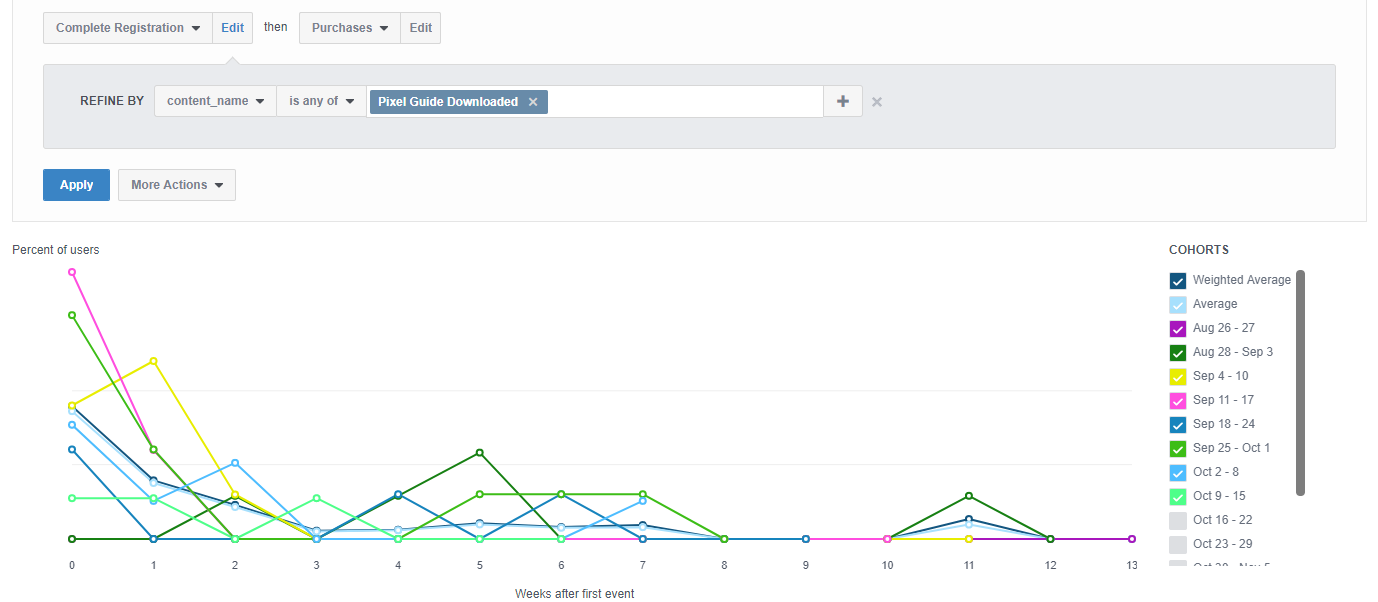
You can set up the time interval to weeks or days. This way you can see the percent of people who performed the second event after completing the first one during each week of the selected interval. In my case, I can see what percent of the people who downloaded the guide decided to buy one of our products. It seems like most purchases are completed in the first week, but there’s an interesting surge in week 11.
Breakdowns
Breakdowns are another great way to understand your traffic. They show you more details about the groups of people using your website, such as insights about devices, demographics, or events parameters.
Facebook will install a few by default, but you can be extremely creative here and make your own ones.
These breakdowns are created automatically:
- Traffic Sources
- Social Sources
- Search Sources
- Purchase by Device OS and Device Type
- Top URLs
- Page Views by Country, Region, and City
- Page Views by Device, Type
- Top Referer Domains
Create any custom breakdown by choosing an event and then adding up to 3 dimensions that help you analyze it.
Examples
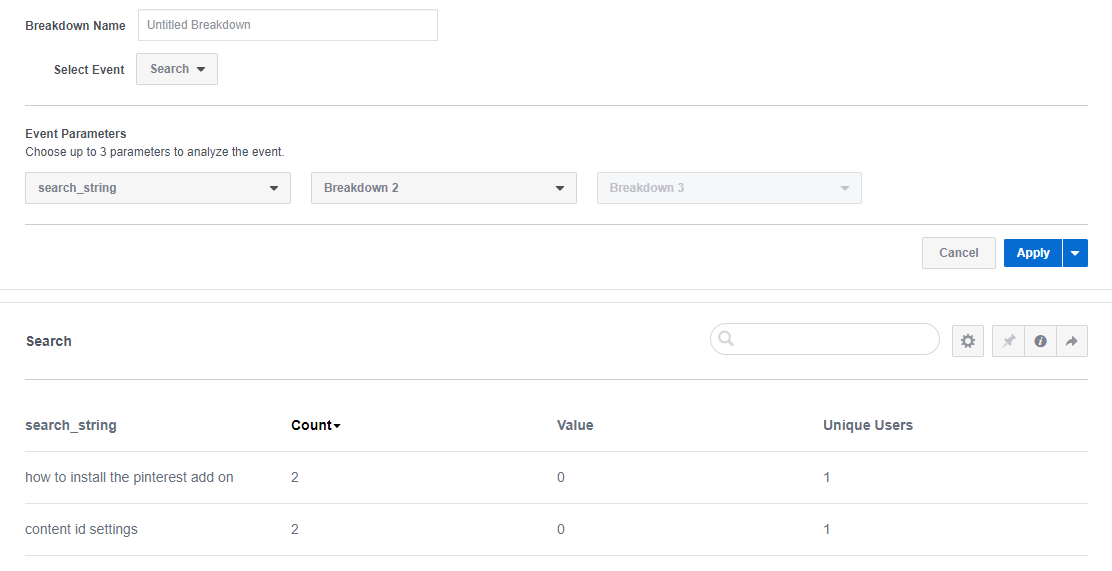
Do you want to see what searches have been performed on your website? It’s easy: select the Search event and it’s search_string parameter. This will show you a list of the searches made by your visitors, the count, and the unique number of users. Value won’t be relevant to this event.
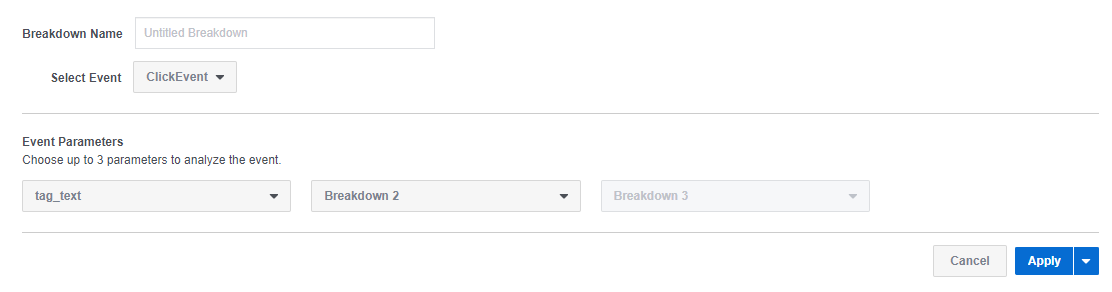
Here’s an example based on the PixelYourSite ClickEvent and the tag_text parameter (it pulls the button or link text). It will show you what buttons or links are clicked on your website, how many times, and by how many unique users.
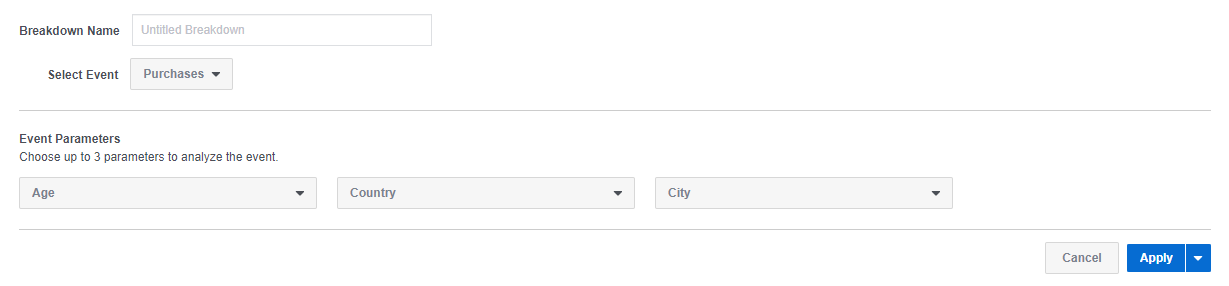
Here’s another one, based on the Purchase event, age, country and city. It’s just an example of what level of detailed reporting you can get with this feature. In order for such a breakdown to work, the amount of data that Facebook needs to process is fairly large, so you will probably have to select a longer reporting time period.
PROBLEM: If the user leaves your website to complete the payment and then it’s redirected back, it’s possible that Facebook will consider the payment processor as a referer. Because of this, some of the breakdowns for the Purchase event are not working as they are supposed to. It’s probably something they will eventually fix since Google Analytics manages to do this job correctly.
Potential fix: you can use some of the PixelYourSite default parameters instead: traffic source, utm_campaing, utm_content, utm_source, utm_term. We add these parameters to all your pixel events. They were designed to work with Custom Audiences and Custom Conversions, but they can be of use here as well.
Events
That’s where you can see statistics for all the events fired on your website, standard and custom included. If you have a large number of old and unused events that you don’t need to check anymore, there is an option to deactivate them (top right corner). This will simply hide the unwanted events from the stats.
If the event has a value parameter, you will see the cumulative value for the selected interval.
TIP: In most cases, only the Purchase event will show a correct value, related to your business revenue. It’s complicated to attribute a value to the other events.
Click on any of the events for more in-depth details.
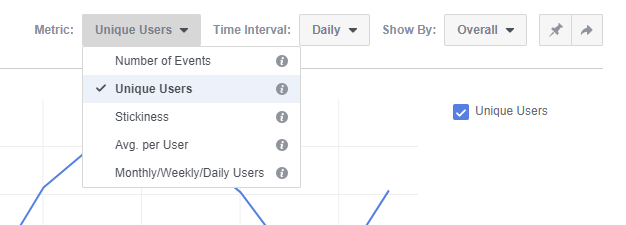
You can check the total number of events, unique users, stickiness, average number of events per user, monthly/weekly/daily users.
Breakdown events (Show By)
You can display stats by Event Info or Custom Parameter.
Event Info
Under Event Info you will find a serious amount of data that Facebook collects about your traffic. Not everything will be available for your website, with some of the options being app related. You still have plenty to play with.
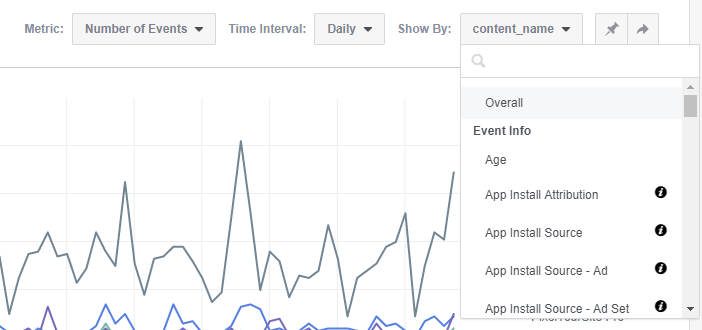
Custom Parameters
As the name says, these are the parameters each of your events sends to Facebook. If you use PixelYourSite Pro, you’ll have quite a few parameters at your disposal.
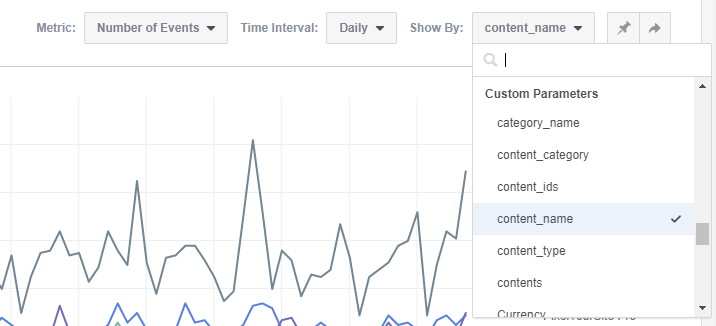
Examples:
Herer’s the GeneralEvent (fired by PixelYourSite Pro on every page) shown by the content_name custom parameter. The GeneralEvent’s content_name parameter pulls the page title as its value, so this graphic will display the most visited pages of your site by title.
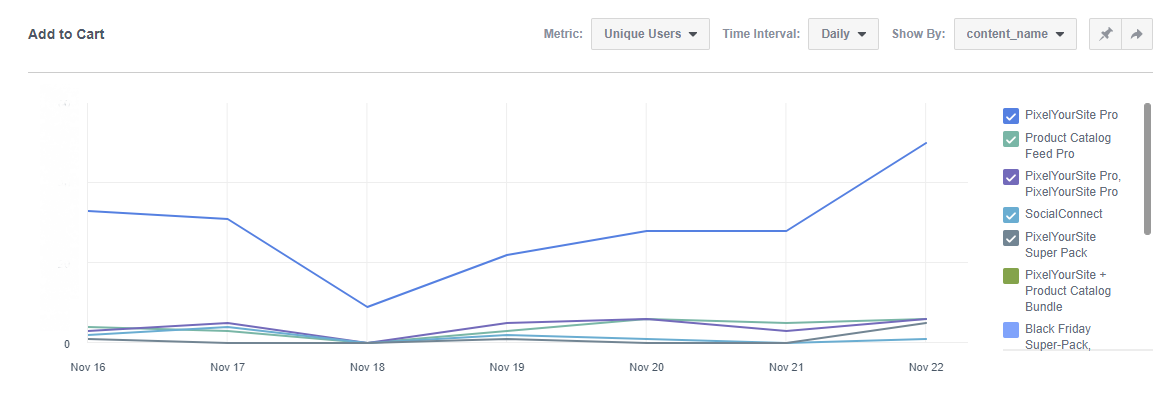
If you have a WooCommerce or Easy Digital Downloads site, you can see all sorts of useful data. Let’s say you want to check what products have been added to cart in the last week. You will open the AddToCart event and you’ll select Show By content_name. The content_name parameter of the AddToCart event pulls the product name.
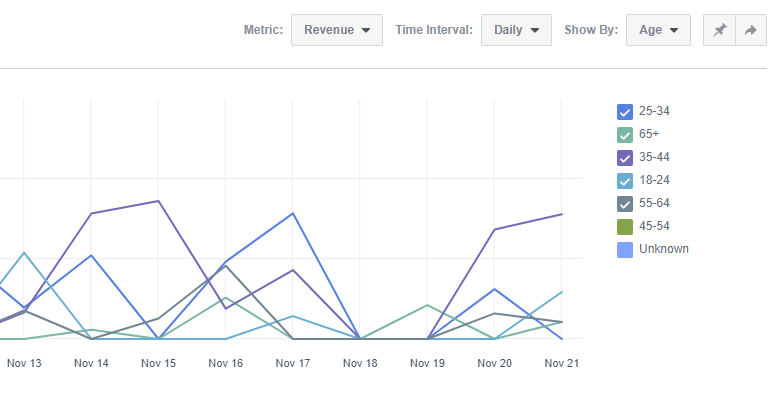
For the Purchase event, you’ll be able to see some really interesting stats regarding your revenue. Here’s, for example, a breakdown by age:
You can easily spend a few hours just by analyzing all the data that Facebook is making available here. It’s really interesting an can give you some very valuable insights about your business.
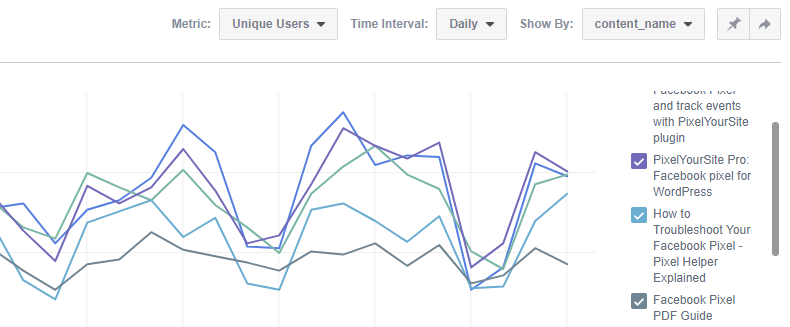
You can now implement custom events to track important actions that your audience is performing. It can be a click, or page scroll, even mouse over some element. It can really be anything you want. Once the event is configured, it will start to show inside your Analytics.
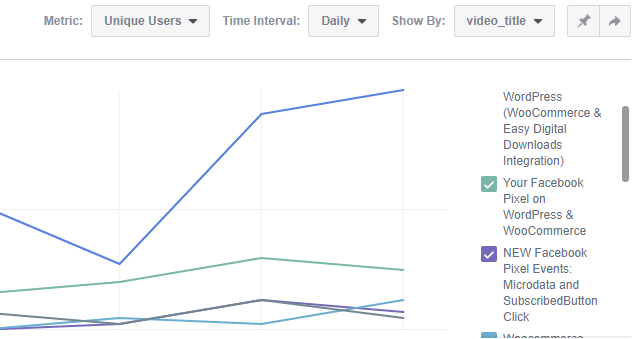
You can also use the custom events that PixelYourSite Pro automatically fires on your website. Here’s a report for the WatchVideo event, shown by the video_title parameter.
This way I can easily see what embedded video performs best.
Events Debugging
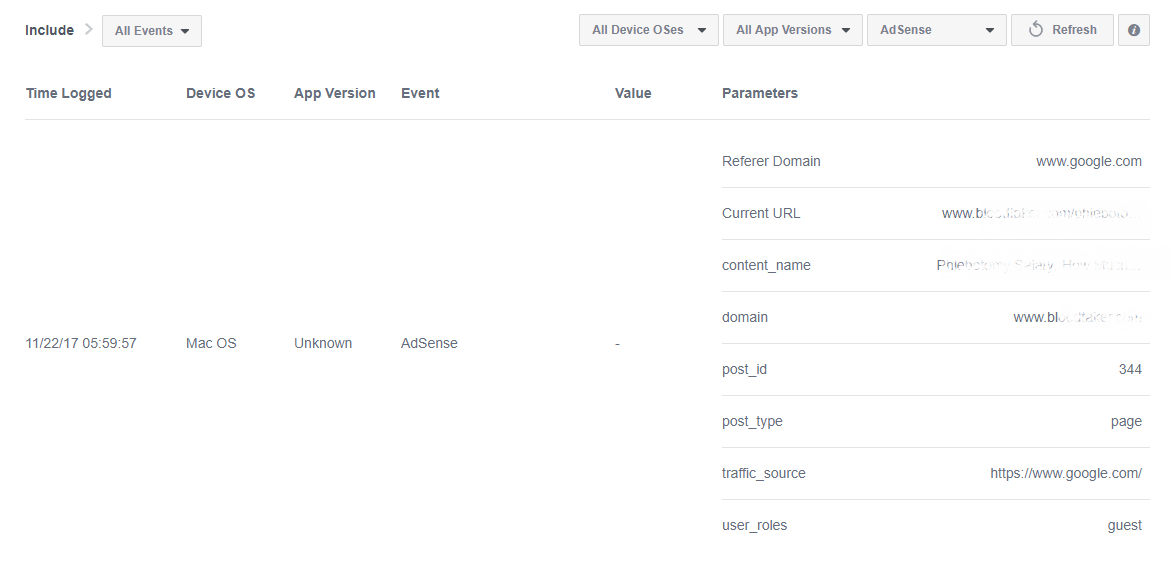
Here’s where you can see all the events fired by the pixel and all their parameters. It’s a report I encourage you to check, even just to see what fantastic volume of data PixelYourSite is sending to Facebook.
That’s an AdSense event (fired by our plugin when an AdSense ad is clicked):
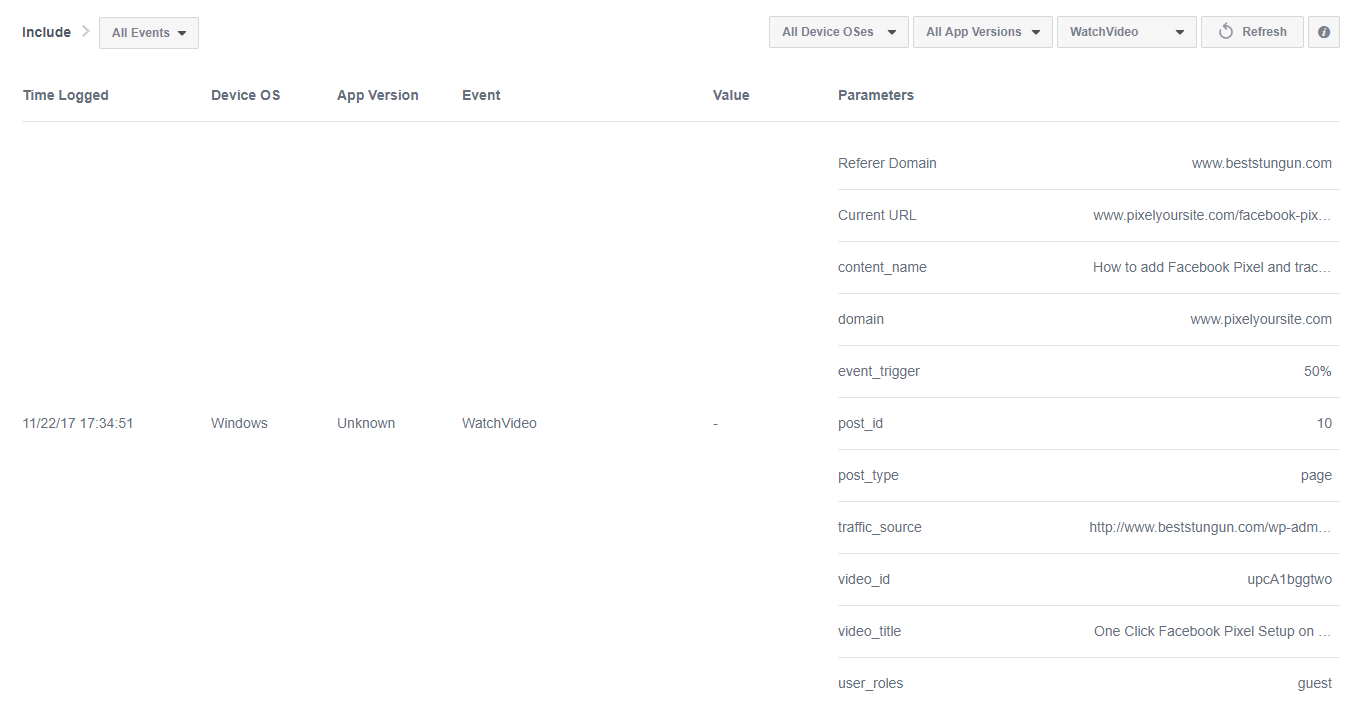
I wanted to add a screenshot with one of our Purchase events, but there are so many parameters, it makes it impossible to have one here without making this all blog post look awkward. I counted about 25 different rows for a single event. I’ll settle for a WatchVideo event, with “just” 11 parameters:
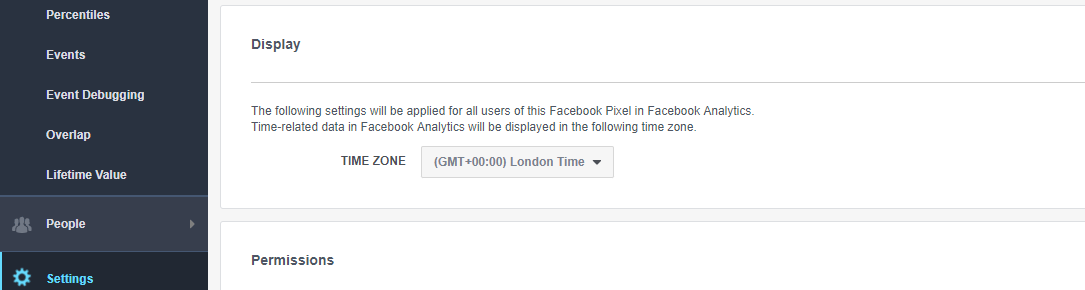
Reports time zone
You can change your time zone report from the Settings menu. I suggest you synchronize it to the same time zone you have configured on your server, especially if you run an e-commerce store. This way your transaction-related reports will be closer to your website’s own numbers.
Limitations and potential problems
The main problem that I see with the Facebook Analytics for websites, is that the pixel itself doesn’t work if an ad blocker is present. That’s something that will happen no matter how you install and configure the pixel. Most ad blockers will simply block the pixel related JS file that’s used to collect the info. Despite this, Facebook is saying that the latest version of Analytics can, however, show info collected from users with ad blockers installed. I am not sure how this can be possible, but I hope that’s something that Facebook can address in the near future.
Conclusion
As I mentioned before, this is not a complete Facebook Analytics guide. Not by far, I would say. It’s just a starting point that will help you to get familiar with this incredibly complex and useful tracking tool.
If you are a complete newbie, it will look intimidating at first, but once you spend some time immersed in the data, it will all start to come together. If you are already a Google Analytics user, you’ll find some of the things at least little bit familiar. There are noticeable differences and a general feeling of a more modern beast. It’s somehow more intuitive and user-friendly, and that’s a major plus.
I didn’t even touch the People analysis features here because I tried to concentrate mostly on the pixel related part. This must be a topic for a different article altogether.
3 Responses
Good one. When it comes to Facebook analytics, precision and expertise is very much required. To know more about this topic, visit nu insights.
Hi,
Maybe a dumb question – I assume all this data is from people who have visited the site from Facebook ads? Is that correct?
Thanks
No, actually that’s global data, regardless of the traffic source