Facebook Analytics: The Ads Reports will only show data related to your Facebook Ads. For a complete image of your site traffic or your pixel events, you can use Facebook Analytics. We have an article here
The default report template that you’ll see for your ads it’s pretty useful, but can also be incomplete and confusing. If you want to really understand what’s going on with your ads you must customize the columns of the report. If you’re running campaigns optimized to deliver results based on pixel events this step has a crucial importance for a correct assessment of your results.
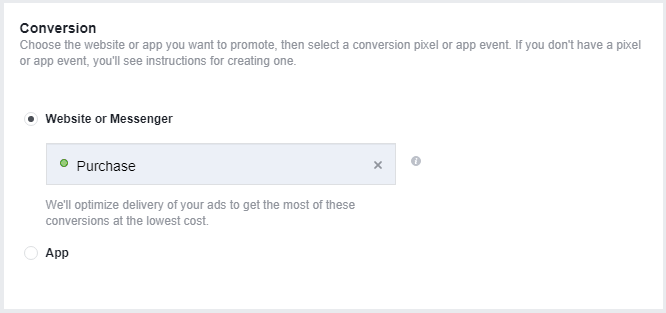
Let’s assume that you’re running a campaign for your WooCommerce website optimized for the Purchase event. Facebook will deliver ads to people most likely to buy something from your site (the Purchase event is triggered once a visitors performs a transaction and lands on the Thank You Page).
However, your Facebook Pixel will also track all other events that you have on your website.
If you’re using the PixelYourSite plugin to manage the Facebook Pixel you probably have other events inside your code: ViewContent (on product pages), AddToCart (on click to the button and on cart page), InitiateCheckout (on checkout page) and any other event that you created. Depending on your ad type, they might appear as conversions in the default reports, under results (the number of actions as a result of your ad). This is where Custom Reports come into rescue.
Create your custom reports
To really understand your ads results, you will have to use this very powerful feature of the reporting system: Customize Columns.
Using the customize columns option you can create in-depth reports that can show you exactly what results your ads have. This can be anything, from a custom conversion to a standard event, but also things that happen on Facebook, like video views, post or page likes.
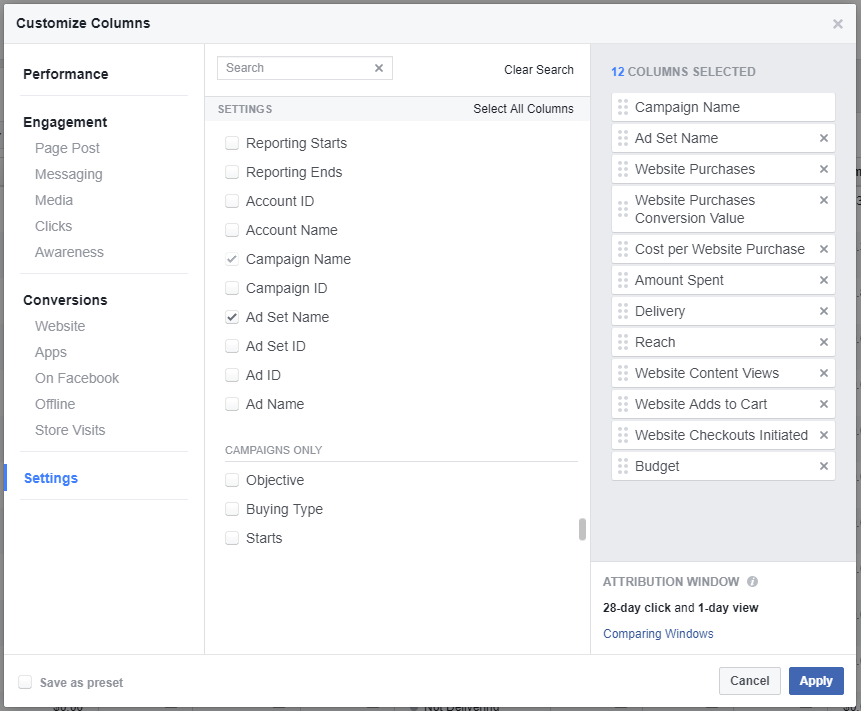
Facebook groups the custom columns in a few categories:
- Performance: key data about your ads performance, like results, reach, frequency, relevance score (ad level only), the amount spent, amount spent today, etc.
- Engagement: page/post interactions, messaging, media views, clicks, awareness
- Conversions: on Website (your pixel events), Apps, On Facebook, Offline, Store Visits
- Settings: reporting starting and ending dates, account ID and name, campaign ID and name, campaign objective and a few other similar things
Tip: select only the columns that can be of real interest for you, otherwise it will be complicated to read the report. Try to keep things simple.
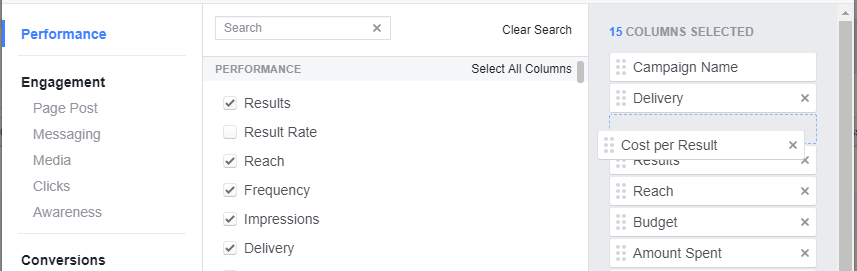
Once selected, the columns will start to appear on the right side of the window. You can drag and drop them to reorder:
When you are happy with the columns and their order, you can save this as a default report. Click “Save as preset” from the bottom left corner and type your name:
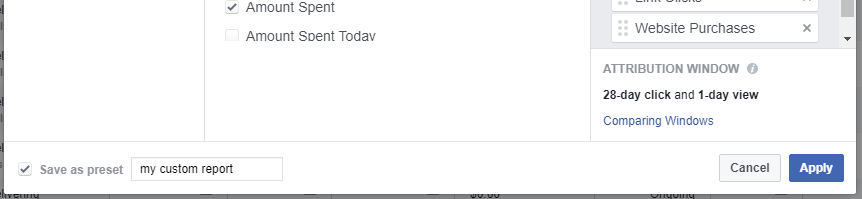
Click “Apply”. Your newly created custom report will appear now in the reports list. If you want, you can use it as your default report. Open the report and under Columns click on the “Save as default”
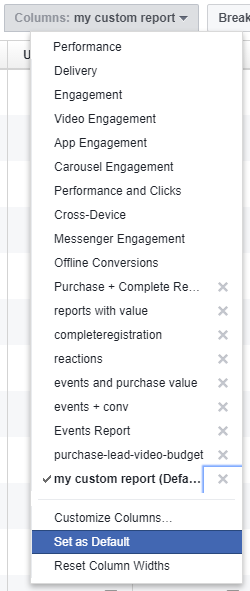
To delete a report click on the X next to it. Only your custom reports can be deleted, not the Facebook predefined ones.
Saving your reports is not mandatory. Sometimes you just want to make a quick analysis that requires customizing some columns.
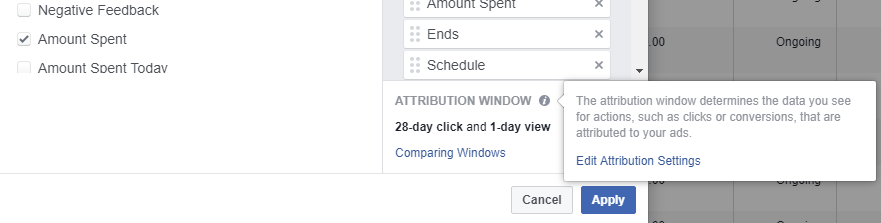
Attribution window
The attribution window determines the data you see for actions, such as clicks or conversions, that are attributed to your ads. By default, Facebook uses 28 days for clicks and 1 days for views. You can change these settings from your ad account reporting settings. To get there, move your mouse over the i next to the ATTRIBUTION WINDOW and click the Edit Attribution Settings link:
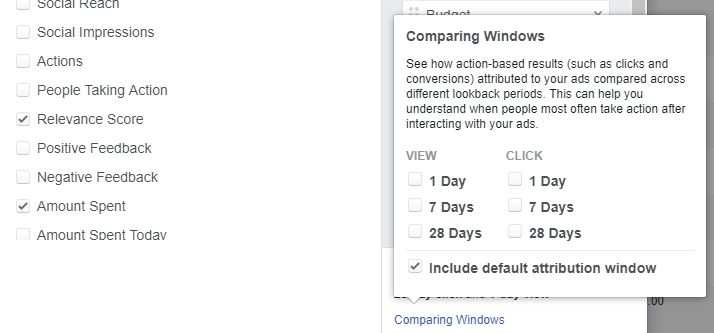
Comparing Windows
See how action-based results (such as clicks and conversions) attributed to your ads compared across different lookback periods. This can help you understand when people most often take action after interacting with your ads.
Click on the “Comparing Windows” link and select your desired time frames:
This type of reporting can give you some useful insights about how long it takes for your ad generated visitors to convert. Sometimes you will be surprised by the results. Why is this important? If you understand how long it takes until someone decides to convert, you can create smarter retargeting campaigns that can improve your overall results.
Breakdown
Once you have your custom reports up and running you can use another interesting feature: breakdown.
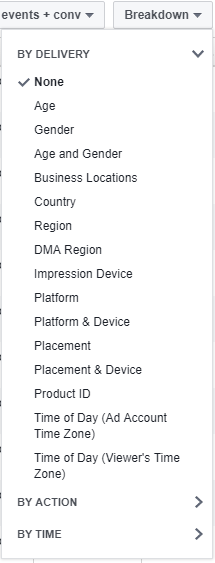
You can break down your reports By Delivery, By Action or By Time. I encourage you to play with this option as well because it can help you find interesting facts about how your visitors interact with your ads.
Customize report for e-commerce sites (WooCommerce or Easy Digital Downloads)
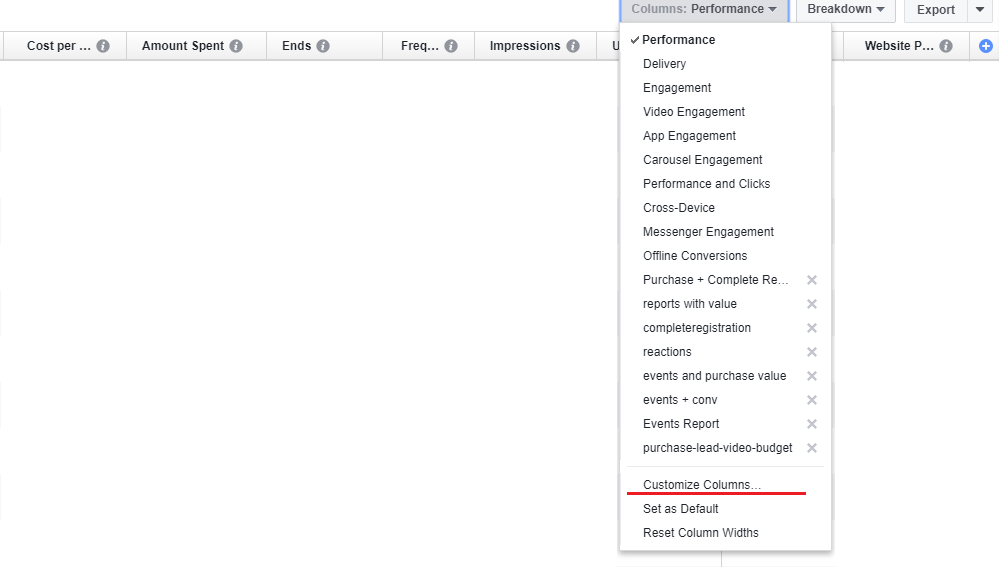
1. Click on Columns and select Customize Columns:

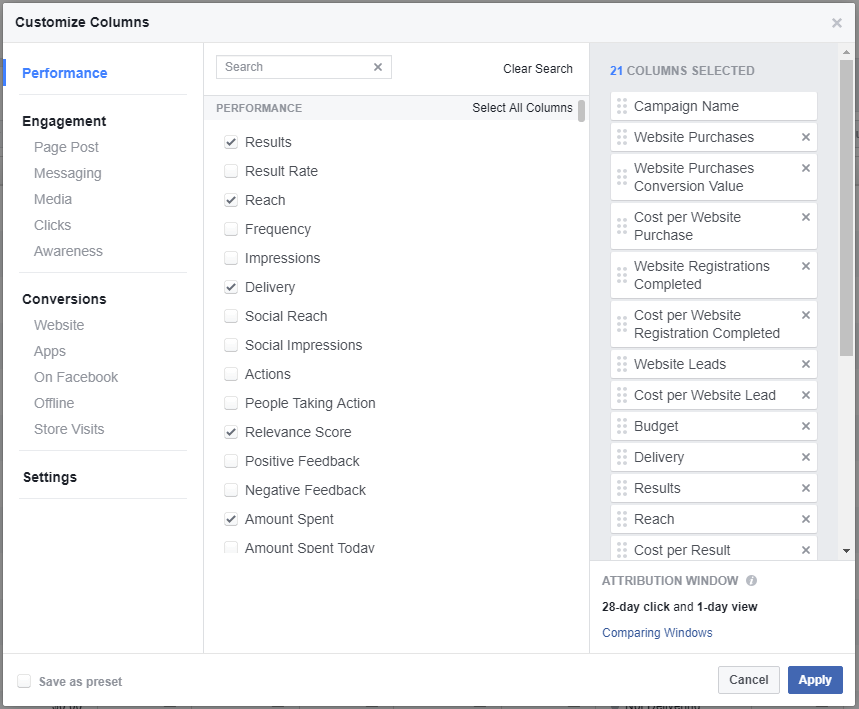
2. Click Website (left part of the popup) and then check:
WEBSITE (FACEBOOK PIXEL):
- Website Add to Cart
- Website Checkout Initiated
- Website Purchase
- Website Content View
COST: WEBSITE (FACEBOOK PIXEL):
- Cost per Website Purchase
CONVERSION VALUE: WEBSITE (FACEBOOK PIXEL):
- Website Purchase Conversion Value
3. In the right side menu, drag and drop to rearrange the columns for better reading.
You can also delete unnecessary columns, to have an easy to understand report. Some columns will be added there by default and you probably won’t need them.
4. Check “Save As Preset” at the bottom of the popup window, type a name for the report template, and click Apply.
It’s probably a good idea to set up this report as your default one, so you will have it loaded every time you open your Ads Reports page.
Following the same steps, you can create a countless number of useful reports and adapt them to the very particular needs that you might have.
3 Responses
This does not look like the current version of business manager I have in front of me.
Hi Richard, if I am running an engagement ad using an existing post from my conversion ad, and I add the column to my custom report for my custom conversion (thank you page) which is set up via the pixel already, will it show these results for this engagement campaign? The option to add this Column is available on an engagement ad. But just double checking it will pull those results to the engagement campaign when using the same post ID.
I hope what I’m asking makes sense… if not, let me know I’ll clarify.
Thanks.
I am using Pixel your site plugin for Facebook and Google Analytics, My analytics showing 11 transactions and Facebook pixel shows 44 purchases in Events manager and 27 in Ads Manager in same period of time. Any ideas why? Since both using the same Plugin?